Annual Report 2022
Annual report 2022 A year of extremes
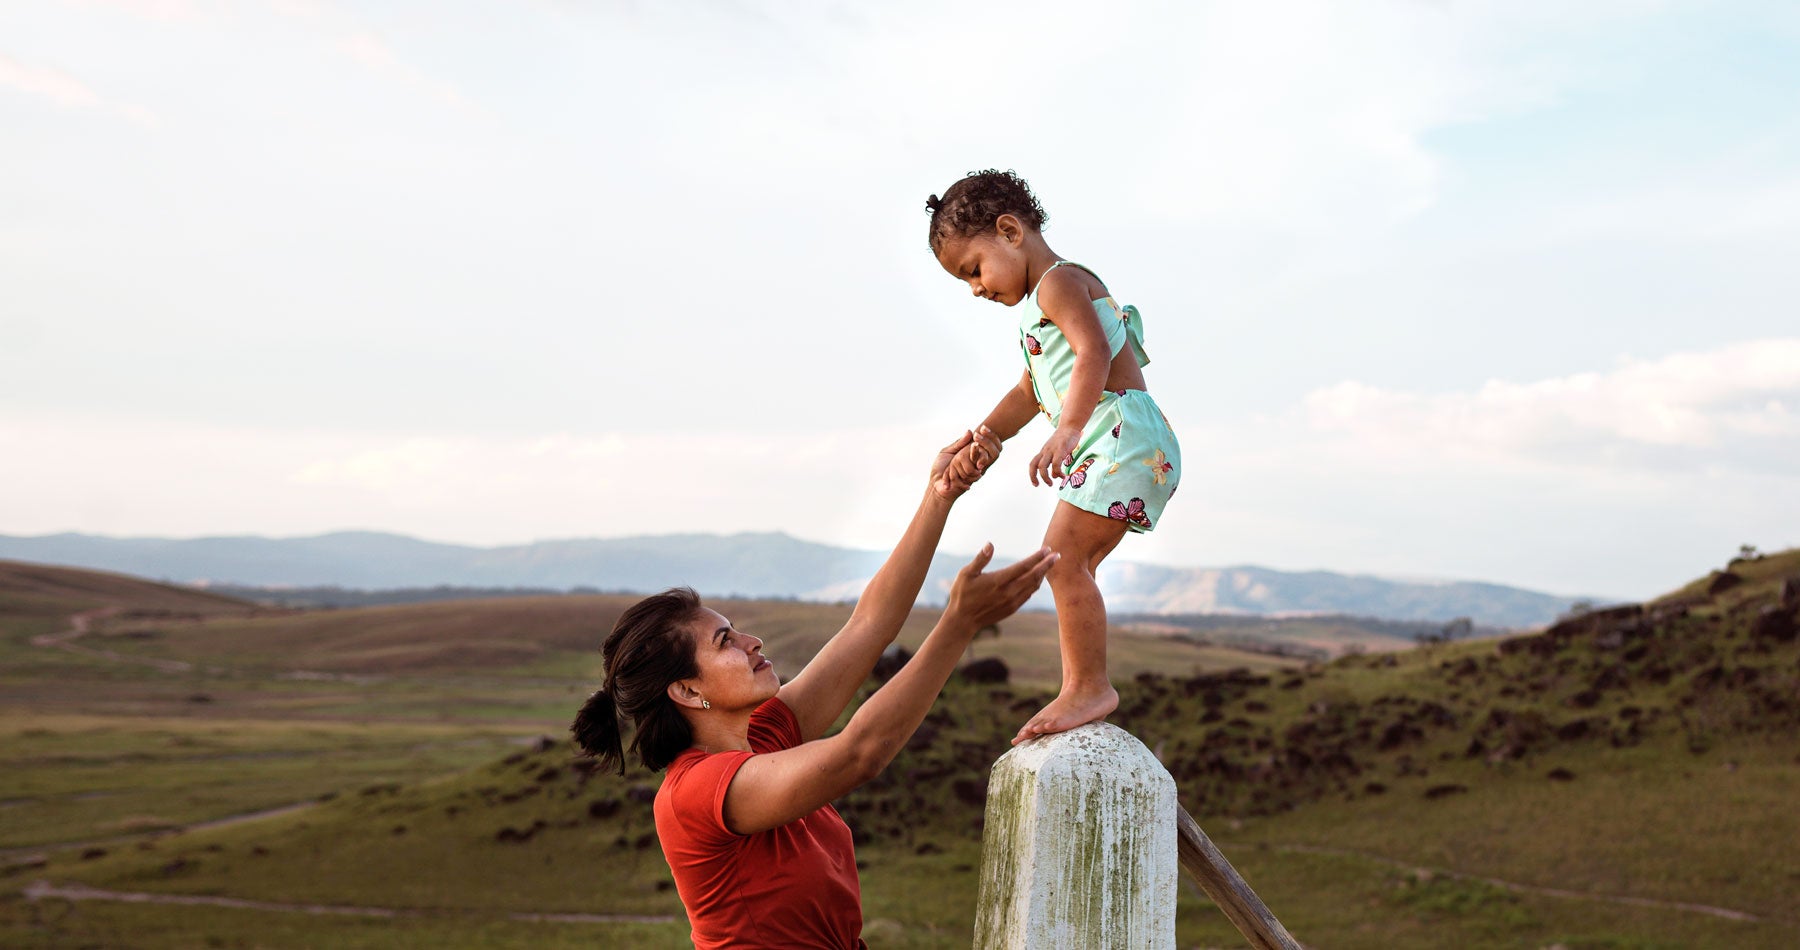
2022 was a "year of extremes". The world witnessed the highest number of violent conflicts since 1945, with more than 103 million people forcibly displaced worldwide. The COVID-19 pandemic continued to disrupt economies, education and health systems, and the global climate catastrophe spiralled further out of control, with heat waves, droughts, floods and other disasters affecting billions. Additionally, economic inequalities grew alarmingly, with 75 million to 95 million more people living in extreme poverty in 2022 compared to pre-pandemic levels. These conditions have pushed the world off track in its efforts to achieve, by 2030, universal health coverage, gender equality and other essential targets of the Sustainable Development Goals. Women and young people continue to bear the brunt of the consequences.
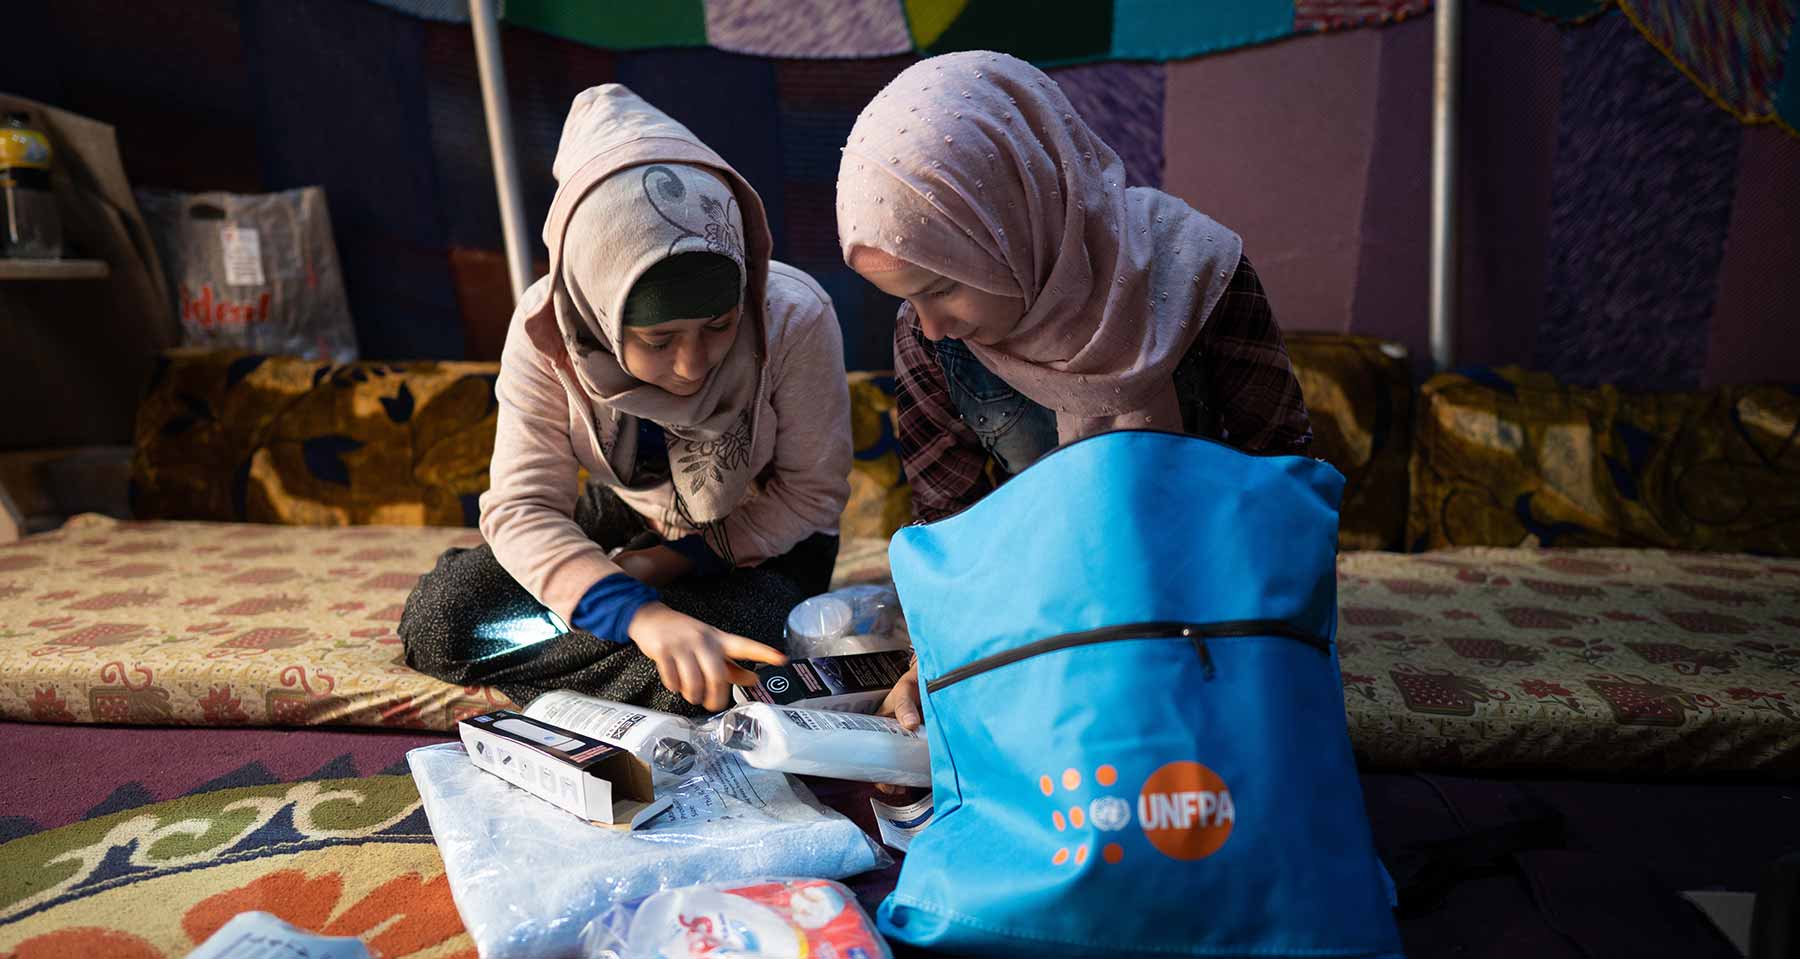
UNFPA rose to the challenge despite these multiple and overlapping crises. The organization scaled up its humanitarian support to provide life-saving services to over 30 million women and young people in 60 emergencies around the world. UNFPA sounded the alarm over stagnating progress in reducing maternal death in 133 countries during the period from 2016 to 2020. And despite the twin economic constraints of inflation and rising energy costs, UNFPA continued to mobilize resources for sexual and reproductive health and rights, including by securing commitments from Governments and by leveraging partnerships and new funding mechanisms. Such efforts offered a lifeline amid the intensifying threats of populism and pushback against gender equality and reproductive rights.
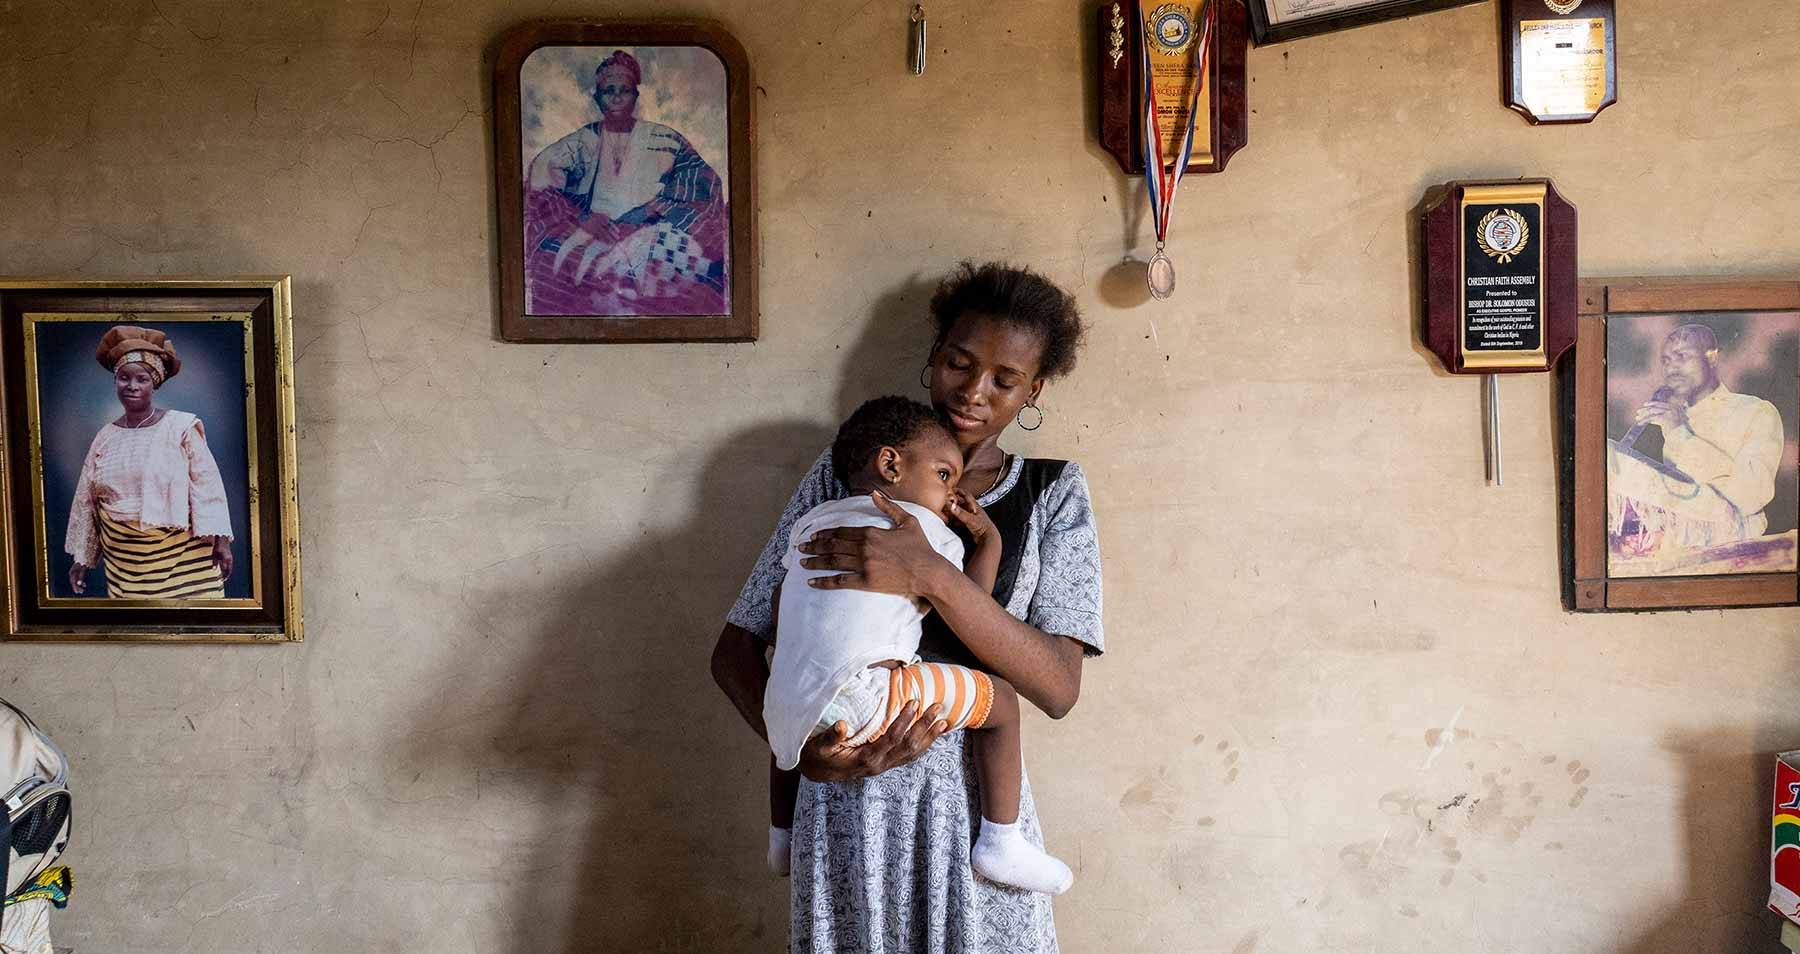
But the year was not simply one of extreme hardship; 2022 also saw remarkable signs of progress. Perhaps most notably, the human population reached 8 billion, the result of historic advances in medicine, science, nutrition, public health and more. Many countries made strides in protecting reproductive health and rights; a historic international agreement called for accountability in addressing climate change; and the global chorus of communities calling for racial, gender and reproductive justice gathered momentum. UNFPA was able to deepen in its support for women-led, youth-led and feminist community organizations and social enterprises. Additionally, progress was made in integrating sexual and reproductive health into national policies and development frameworks, and in the scale-up of interventions to address harmful gender and social norms. Some 6.4 million marginalized adolescent girls were empowered through UNFPA-supported programmes, and youth-led initiatives to prevent maternal mortality, end unmet need for family planning and end gender-based violence were supported in 88 countries, a testament to the tireless labour and leadership of UNFPA’s staff and partners around the world.
Delivering worldwide in 2022
13.3 Million unintended pregnancies were prevented*
30,800 maternal deaths were averted*
111,425 girls were saved from female genital mutilation
3.7 Million unsafe abortions were prevented*
6.4 Million marginalized girls were reached by life-skills programmes
5.1 Million new sexually transmitted infections were averted*
117,000 new HIV infections were averted*
59 Million couple years of protection were provided by UNFPA-procured contraceptives*
1.4 Million safe deliveries were assisted in 39 humanitarian crisis-affected countries
347,000 women and young people with disabilities benefited from services related to sexual and reproductive health, gender-based violence and harmful practices
Contraception provided by UNFPA worldwide:
Male
condoms
1,029,349,152
Female
condoms
7,608,565
Oral
contraceptives
(Monthly cycles of the pill)
47,358,430
Doses
injectable
contraceptives
50,392,250
Contraceptive
implants
8,604,291
Intrauterine
devices (IUD)
1,649,410
Emergency
contraceptives
3,597,500
Personal
lubricants
159,314,644
Regional Results
In 2022, the vision and leadership of UNFPA’s regional and country offices continued to yield significant results despite the rising challenges seen worldwide. Sub-Saharan Africa experienced the largest increase in the percentage of demand for family planning satisfied by modern methods of contraception, growing by 3.6 percentage points between 2017 and 2022. The same period saw Central and Southern Asia report the highest rate of decline in unmet need for family planning. Offices in Latin America and the Caribbean saw strengthened engagement with indigenous communities, Afrodescendants and youth in high-level dialogues and fora. Multiple centres of excellence in the West and Central Africa region raised standards for the provision of family planning technology, menstrual hygiene management and support for gender equality. UNFPA deepened its support to community-based, women-driven organizations, for example through its partnerships with women’s groups addressing gender-based violence in humanitarian emergencies in the Arab States region. And new technologies greatly expanded the reach of essential services, including through the training of some 200,000 midwives and front-line health workers via virtual platforms in the East and Southern Africa region. Still, with progress in reducing maternal mortality stalling globally, and even reversing in some places, accelerated and intensified action is needed across all spheres.
Regional results

Resources and expenses 2022
Donors and contributions in US$
Швеция
70,111,099
Норвегия
60,181,688
Германия
60,063,224
United States of America
50,580,000
Нидерланды
36,194,415
Финляндия
34,381,663
Дания
34,340,659
Швейцария
16,701,461
Япония
16,500,000
Канада
11,748,903
Бельгия
10,215,664
United Kingdom of Great Britain and Northern Ireland
9,950,249
Австралия
6,695,652
Люксембург
5,544,315
Ирландия
4,555,809
Новая Зеландия
3,771,213
Италия
3,348,214
Китай
1,480,000
Франция
1,103,485
Исландия
935,308
United Nations and Interorganizational transfers
217,360,999
United States of America
134,253,269
United Kingdom of Great Britain and Northern Ireland
111,960,230
European Commission
82,139,873
Норвегия
67,922,475
Канада
61,017,955
Нидерланды
49,260,613
Австралия
41,337,109
Дания
37,914,148
Люксембург
37,902,356
Япония
35,044,174
Франция
26,815,946
Италия
20,935,969
Democratic Republic of Congo
20,000,000
Германия
18,517,048
Bill & Melinda Gates Foundation
17,947,783
Швеция
16,037,629
Республика Корея
15,180,700
Takeda Pharmaceutical Company Limited
9,783,301
Испания
9,746,723
Афганистан
1,000
Албания
5,000
Алжир
10,000
Ангола
20,000
Армения
3,000
Австралия
6,695,652
Австрия
243,427
Азербайджан
20,000
Бангладеш
35,000
Барбадос
5,000
Бельгия
10,215,664
Бутан
5,925
Bolivia (Plurinational State of)
6,000
Bosnia and Herzegovina
2,039
Ботсвана
4,675
Буркина-Фасо
10,911
Бурунди
488
Канада
11,748,903
Китай
1,480,000
Колумбия
22,274
Коморские острова
500
Коста-Рика
4,433
Кипр
15,600
Доминиканская Республика
15,000
Дания
34,340,659
Египет
20,725
Сальвадор
2,000
Эритрея
5,000
Эстония
33,784
Эсватини
10,000
Эфиопия
1,139
Финляндия
34,381,663
Франция
1,103,485
Грузия
20,000
Германия
60,063,224
Гайана
8,916
Исландия
935,308
Индонезия
12,451
Ирак
50,000
Ирландия
4,555,809
Израиль
10,000
Италия
3,348,214
Япония
16,500,000
Иордания
49,930
Казахстан
3,000
Кения
10,000
Korea, Republic of
164,079
Кувейт
10,000
Киргизия
50
Lao People's Democratic Republic
6,000
Люксембург
5,544,315
Мадагаскар
14,001
Мальдивские Острова
5,000
Мавритания
5,534
Маврикий
2,345
Мексика
43,225
Micronesia (Federated States of)
3,000
Монголия
4,000
Марокко
11,735
Нидерланды
36,194,416
Новая Зеландия
3,771,213
Никарагуа
2,500
Северная Македония
347
Норвегия
60,181,688
Панама
10,000
Перу
2,017
Филиппины
32,649
Португалия
266,525
Румыния
10,000
Российская Федерация
300,000
Руанда
5,000
Saint Kitts and Nevis
1,500
Сенегал
11,870
Сербия
5,000
Сингапур
5,000
Словакия
4,963
Словения
20,725
Южная Африка
40,330
Испания
266,525
Шри-Ланка
18,000
Швеция
70,111,099
Швейцария
16,701,461
Таджикистан
1,266
Таиланд
150,000
Того
8,909
Тринидад и Тобаго
5,000
Тунис
17,880
Турция
50,000
Туркменистан
8,000
Уганда
10,122
United Kingdom of Great Britain and Northern Ireland
9,950,249
Танзания
3,022
United States of America
50,580,000
Уругвай
5,000
Вьетнам
20,000
Зимбабве
30,000
Private Contributions
1,543,379
Subtotal
442,194,737
Government contribution to local office costs*
275,308
Итого
442,470,045
*All 2022 figures are provisional as of 1 April 2023
UNFPA is funded from voluntary contributions that fall into two distinct categories:
1 These amounts represent contributions received in 2022 for core resources. Due to policy change, in 2023, UNFPA will report on payments received. Core contributions (also referred to as "regular", "unearmarked" or "unrestricted" contributions), represent resources that are unrestricted as to their use;
2 Non-core contributions (also referred to as "other", "earmarked" or "restricted" contributions), represent resources that are earmarked as to their use. The amounts represent contribution revenue for trust funds. They include multi-year co-financing agreements which were recognized in 2022, in accordance with UNFPA accounting policies. Programme implementation continues to be linked to actual receipt of resources.
Programme and institutional budget Expenses by region in millions of US$
Core resources $ millions
Non-core resources $ millions
Institutional budget $ millions
TOTAL $ millions
East and Southern Africa
Core resources72.8
Non-core resources192.4
Institutional budget19.8
TOTAL285.1
West and Central Africa
Core resources64
Non-core resources109.6
Institutional budget21.3
TOTAL194.9
Arab States
Core resources34.8
Non-core resources182.5
Institutional budget14
TOTAL231.3
Asia and the Pacific
Core resources67.4
Non-core resources164.5
Institutional budget18.5
TOTAL250.4
Latin America and the Caribbean
Core resources31.4
Non-core resources51.9
Institutional budget14.3
TOTAL97.5
Eastern Europe and Central Asia
Core resources18.3
Non-core resources67.6
Institutional budget8
TOTAL94
Global activities
Core resources19.4
Non-core resources141.7
Institutional budget93.1
TOTAL254.2
TOTAL
Core resources308.1
Non-core resources910.2
Institutional budget189
TOTAL1,407.3
Programme expenses by country includes core and non-core resources
Ангола
5.8
Ботсвана
1.8
Бурунди
6.4
Коморские острова
1.7
Congo, Democratic Republic of the
37.9
Эритрея
1.2
Эсватини
1.7
Эфиопия
32.3
Кения
8.0
Лесото
2.0
Мадагаскар
10.9
Малави
16.5
Маврикий
0.3
Мозамбик
31.2
Намибия
2.3
Руанда
8.6
Южная Африка
3.3
Южный Судан
28.0
Уганда
24.5
United Republic of Tanzania
23.6
Замбия
9.3
Зимбабве
12.3
Total country/territory activities
269.7
Regional activites
15.3
Total for East and Southern Africa
285.1
Бенин
8.0
Буркина-Фасо
15.4
Cabo Verde
1.3
Камерун
12.0
Центральноафриканская Республика
6.7
Чад
11.2
Congo
3.1
Côte d'Ivoire
10.1
Экваториальная Гвинея
1.6
Габон
2.1
Гамбия
4.3
Гана
8.5
Гвинея
6.4
Гвинея-Бисау
2.4
Либерия
13.4
Мали
17.6
Мавритания
3.1
Нигер
13.3
Нигерия
22.7
São Tomé and Príncipe
0.9
Сенегал
6.8
Сьерра-Леоне
8.0
Того
4.9
Total country/territory activities
183.9
Regional activites
11.0
Total for West and Central Africa
194.9
Алжир
0.9
Джибути
1.9
Египет
10.6
Ирак
19.3
Иордания
11.1
Ливан
5.3
Ливия
6.3
Марокко
3.3
Оман
1.6
Сомали
36.4
State of Palestine
8.8
Судан
25.6
Syrian Arab Republic
40.1
Тунис
1.4
Йемен
49.0
Total country/territory activities
221.5
Regional activites
9.8
Total for Arab States
231.3
Афганистан
51.2
Бангладеш
48.9
Бутан
0.9
Камбоджа
3.8
Китай
3.6
Korea, Democratic People's Republic of
1.1
Индия
9.9
Индонезия
7.8
Iran (Islamic Republic of)
3.8
Lao People's Democratic Republic
4.3
Малайзия
0.9
Мальдивские Острова
0.9
Монголия
3.2
Myanmar
21.6
Непал
10.6
Pacific Islands (multi-country) 1
14.8
Пакистан
15.6
Папуа – Новая Гвинея
8.5
Филиппины
10.5
Шри-Ланка
4.6
Таиланд
1.2
Тимор-Лесте
3.9
Viet Nam
6.5
Total country/territory activities
238.2
Regional activites
12.2
Total for Asia and the Pacific
250.4
Албания
1.1
Армения
1.6
Азербайджан
1.4
Беларусь
1.7
Bosnia and Herzegovina
2.0
Грузия
2.1
Казахстан
2.0
Kosovo 2
1.0
Киргизия
2.4
Moldova, Republic of
10.7
Северная Македония
1.3
Сербия
1.1
Таджикистан
2.7
Türkiye
26.1
Туркменистан
2.0
Украина
23.7
Узбекистан
2.5
Total country/territory activities
85.6
Regional activites
8.4
Total for Eastern Europe and Central Asia
94.0
Аргентина
1.4
Bolivia (Plurinational State of)
6.1
Бразилия
4.5
Caribbean (multi-country) 3
6.7
Чили
0.2
Колумбия
6.5
Коста-Рика
1.0
Куба
1.1
Доминиканская Республика
1.9
Эквадор
6.4
Сальвадор
3.7
Гватемала
4.8
Гаити
12.6
Гондурас
3.6
Мексика
4.5
Никарагуа
3.1
Панама
1.2
Парагвай
4.9
Перу
3.9
Уругвай
3.0
Venezuela, Bolivarian Republic of
7.3
Total country/territory activities
88.5
Regional activites
9.0
Total for Latin America and the Caribbean
97.5
1 Figures for the Pacific Islands (multi-country) covers the following countries: Cook Islands; Fiji; Kiribati; Marshall Islands; Federated States of Micronesia; Nauru; Niue; Palau; Samoa; Solomon Islands; Tokelau; Tonga; Tuvalu; and Vanuatu.
2 References to Kosovo shall be understood to be in the context of Security Council resolution 1244 (1999).
3 Figures for the Caribbean (multi-country) covers the following countries and territories: Anguilla; Antigua and Barbuda; Aruba; Bahamas; Barbados; Belize; Bermuda; British Virgin Islands; Cayman Islands; Curacao; Dominica; Grenada; Guyana; Jamaica, Montserrat; Netherlands Antilles; St. Lucia; St. Kitts and Nevis; Saint Maarten (Dutch part); Saint Vincent and the Grenadines; Suriname; Turks and Caicos; and Trinidad and Tobago.
Revenue and expenses in millions of US$
Core resources
Contribution to core resources
390.9
Less: transfer to other revenue for reimbursement of tax charges
(5.5)
Other revenue
98.3
Total core resources revenue
483.7
Non-core resources
Contribution to non-core resources—gross
1,108.7
Less: refunds to donors
(9.9)
Less: indirect costs
(66.2)
Less: allowance for doubtful contributions receivable
(2.1)
Other revenue
13.4
Total non-core resources revenue
1,048.1
Total revenue
1,531.8
Core resources
Country programmes, Global and Regional Interventions (GRI) and other programme activities
308.1
Institutional budget
189.0
Corporate
34.7
Total core resources expenses
531.8
Non-core resources
Country programmes, Global and Regional Interventions (GRI) and other programme activities
910.2
Corporate
11.7
Total non-core resources expenses
921.9
Total expenses
1,453.7
*All figures are provisional, subject to external audit and, as a result of rounding, may not add up to the totals.